> For the complete documentation index, see [llms.txt](https://docs.clv.org/llms.txt). Markdown versions of documentation pages are available by appending `.md` to page URLs; this page is available as [Markdown](https://docs.clv.org/use-clv-chain/economics/inflation-design.md).
# Inflation Design
The CLV chain adopts the same inflation design as Polkadot's, as it's a proven and long-term economical design that we think fulfills the future development of the CLV ecosystem.
Inflation to validators is dynamic, between 2.25% - 20% annually, depending on $CLV staking rate on CLV Mainnet.
Although the total number of $CLV in circulation is the combination of the number of tokens on 4 chains ($CLV on Ethereum, BNB Chain, CLV Parachain and CLV Mainnet), the inflation model is only subject to the amount of $CLV circulating on the CLV Mainnet.
| Staking Rate | Inflation to Stakers | Monthly Reward Rate | Yearly Reward Rate |
|---|
| 0% | 2.25% | >125% | >1,500% |
| 5% | 3.25% | 5.42% | 65% |
| 10% | 4% | 3.33% | 40% |
| 20% | 5.5% | 2.29% | 27.5% |
| 25% | 6.25% | 2.08% | 25% |
| 30% | 7% | 1.94% | 23.3% |
| 40% | 8.5% | 1.78% | 21.3% |
| 50% | 10% | 1.67% | 20% |
| 60% | 4.38% | 0.61% | 7.3% |
| 70% | 2.97% | 0.35% | 4.2% |
| 80% | 2.62% | 0.28% | 3.3% |
| 90% | 2.53% | 0.23% | 2.8% |
| 100% | 2.51% | 0.21% | 2.51% |
### Inflation & Staking Rate Formula

The value of the staking rate should lie between 30% and 60% - **ideally at 50%.** If it falls, the security is compromised, so we should give strong incentives to $CLV holders to stake more of their assets. If it rises, we lose liquidity, so we should decrease the incentives sharply.
`x = staking rate(x is always a value between 0 and 1)`\
\&#xNAN;*`green graph`*` ``= i (x) yearly`` `*`interest rate`*\
\&#xNAN;*`blue graph =`*` ``I (x)`` `*`inflation rate to stakers`*
x-axis represents the total staking rate, y-axis interest rate (green) or inflation to validator rate (blue)
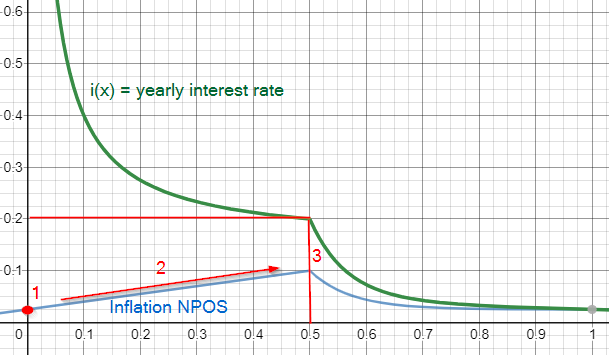
1. Number 1 displayed in the graph is the minimum of the inflation to stakers (i.e. when neither validators nor nominators are staking $CLV). It’s the inflation “starting” point; 0.025 → 2.5% in this case goes away for validator rewards.
2. The second number shows a linear increase of inflation if the staking rate is between 0 and 50%. There is a linear correlation between the staking rate and inflation till 0.5 is reached. The inflation rate is 5% if the staking rate is at 25%. If the staking rate doubles to 50%, so does the inflation rate to 10%. But remember: It is only linear till 50% staking rate is reached.
3. The red line at number 3 is the ideal staking rate of 50%. In this case, the annual staking reward is at 20%. But if the staking rates exceeds 50%, there is an exponential decay in inflation, which results in a strong decay of staking rewards. The reason for that is that the network needs liquidity and decreases the incentives sharply if the staking rate exceeds 50%.
\
\
For Further Reference (Polkadot inflation design 2021):
1. [Polkadot’s Tokenomics and Interoperability](https://www.coinbase.com/en-sg/institutional/research-insights/research/tokenomics-review/polkadot-interoperability) - Coinbase Research
2. [Polkadot Inflation and Staking Reward Analysis](https://swiss-staking.medium.com/polkadot-inflation-staking-reward-4ea753380e0e) - Swiss Staking
3. [Economics of Polkadot](https://polkadot-blockchain-academy.github.io/pba-book/economics/economics-of-polkadot/page.html) - Polkadot Blockchain Academy
4. [Web3 Foundation’s Overview of Polkadot’s Token Economics](https://research.web3.foundation/en/latest/polkadot/overview/2-token-economics.html) - Web3 Foundation
---
# Agent Instructions
This documentation is published with GitBook. GitBook is the documentation platform designed so that both humans and AI agents can read, navigate, and reason over technical content effectively. Learn more at gitbook.com.
## Querying This Documentation
If you need additional information that is not directly available in this page, you can query the documentation dynamically by asking a question.
Perform an HTTP GET request on the current page URL with the `ask` query parameter, and the optional `goal` query parameter:
```
GET https://docs.clv.org/use-clv-chain/economics/inflation-design.md?ask=&goal=
```
`ask` is the immediate question: it should be specific, self-contained, and written in natural language.
`goal` is optional and describes the broader end goal you are ultimately trying to accomplish on behalf of the user. GitBook uses it to tailor the answer towards what is most useful for that goal.
The response will contain a direct answer to the question and relevant excerpts and sources from the documentation.
Use this mechanism when the answer is not explicitly present in the current page, you need clarification or additional context, or you want to retrieve related documentation sections.